
Fig. 1.
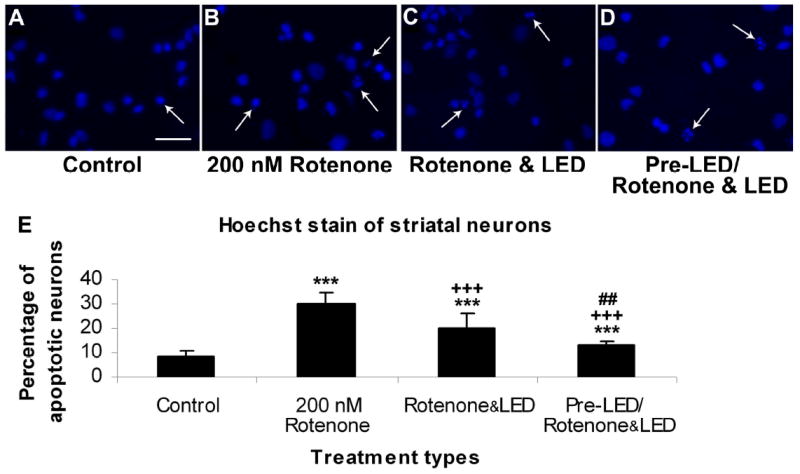
Hoechst staining of cultured striatal neurons in control (A), rotenone exposed (B), rotenone plus LED treated (C), and LED pretreatment for 2 days before rotenone exposure plus LED treatment during rotenone exposure (D). The arrows show apoptotic neurons with nuclear condensation or decreased nuclear size, with or without nuclear fragmentation. Quantitative assays of percent apoptotic neurons under various conditions are shown in E. Rotenone exposure significantly increased the number of apoptotic neurons (P < 0.001), and LED treatment markedly reduced this percentage (P < 0.001). However, LED pretreatment further reduced this percentage (P < 0.01).
All “* P” values were compared to controls: ** P < 0.01, *** P < 0.001. All “+P” values were compared to MPP+ or rotenone alone: ++ P < 0.01, +++ P < 0.001. All “#P” values compared “LED pretreatment plus LED treatment during toxin exposure group” to “LED during toxin exposure only group”. Scale bar: 25 μm for all.