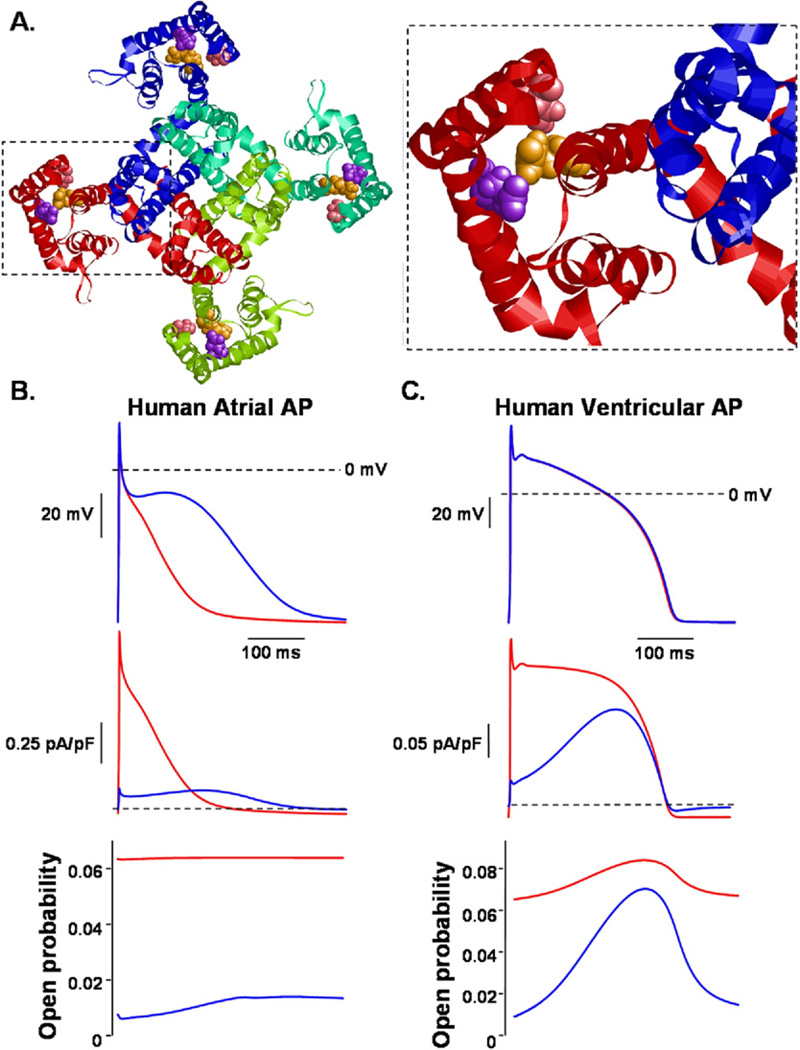
Figure 5.
A, left: Structural model of Q1 in the closed state from the “extracellular” side looking into the pore. The backbone of each individual Q1 α-subunit is shown as a different colored ribbon. The space filled atoms for the S140 (pink), E160 (purple), and R231 (orange) residues are shown in each α-subunit. Right: Red α-subunit magnified. The side chains of S140 and E160 are predicted to be close enough to form van der Waals contacts with R231 in the closed state. B: Computational model of a human atrial action potential (AP) waveform pulsed at 1 Hz with the corresponding IKs and channel open probability. Blue traces represent control conditions. Red traces show a modification of the model that included a reduction in the number of functional channels by ~50% and a small constitutively active IKs. C: Computational model of a human ventricular AP pulsed at 1 Hz with the corresponding IKs and channel open probability. Blue traces represent control conditions. Red traces show a modification of the model that included the same reduction in functional channels and constitutively active IKs as shown in panel B.

