
Fig 1.
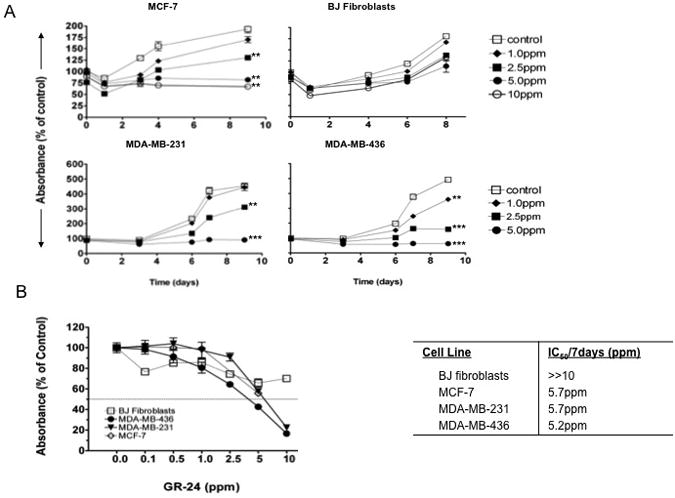
Effect of GR-24 on breast cancer cell line proliferation. MDA-MB-231, MDA-MB-436, MCF-7 and BJ ‘normal’ fibroblasts were exposed to varying concentrations of GR-24 for up to 10 days. At the indicated time points, plates were stained with crystal violet. Data are reported as the Percent Absorbance (560nm) of vehicle control. Average ± standard deviations (SD). Student's t-test (2-tailed, paired) was used to evaluate GR-24 treated groups with vehicle (control) groups at final time point and regarded as being significant if p < 0.05 (*), very significant if p<0.01 (**), extremely significant if p<0.001 (***). (B) Graph showing the light absorbance reading (560nm) after 7 days exposure to the indicated doses of GR-24. Data expressed as a percentage of vehicle controls. Average of triplicate samples ± SD. Horizontal line (---) marks 50% reduction in Absorbance (560nm) relative to vehicle controls. Right, Table showing inhibitory concentrations required for 50% reduction in growth after 7days (IC50/72d), and calculated by performing linear regression with interpolation between relevant y-axis data points (GraphPad Prism Software).