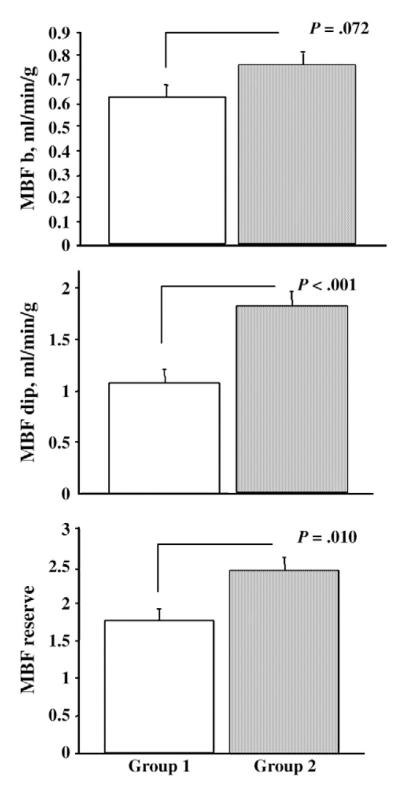
Fig. 3.

Myocardial blood flow and adiponectin. Myocardial blood flow b (top), MBF dip (middle), and MBF reserve (bottom) are severely reduced in patients of group 1 (ie, with adiponectin lower than the median value, 9.1 μg/mL; interquartile range, 7.625) with respect to patients of group 2 (ie, with adiponectin higher than the median value). Mean values and SEM are shown.
