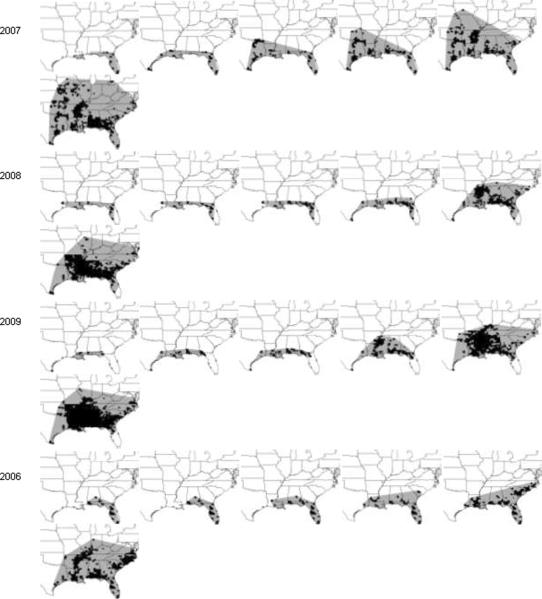
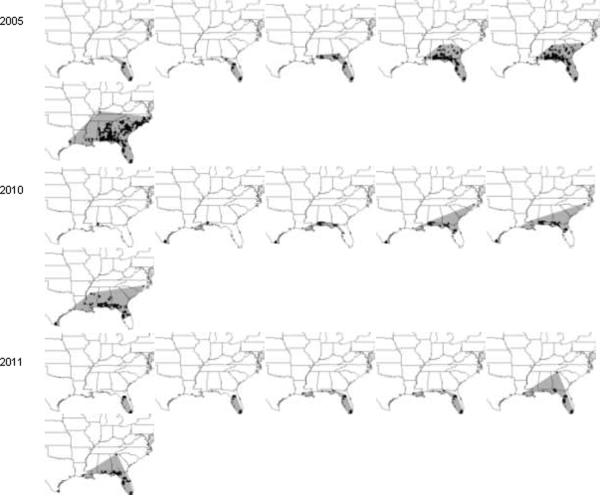
Fig. 1.
Maps of soybean rust spread in the U.S. and Canada, 2005–2010. Examples shown are for calendar weeks 20, 25, 30, 35, 40, and 52. Cumulative county-level detections in each year are shown with black fill. Detections at leading edges of the epidemics were connected with straight lines each week and the resulting areas (shaded) were used to calculate the area of epidemic extent. Maps are shown in descending order with the year of greatest final epidemic extent (2007) in the top row of the figure


