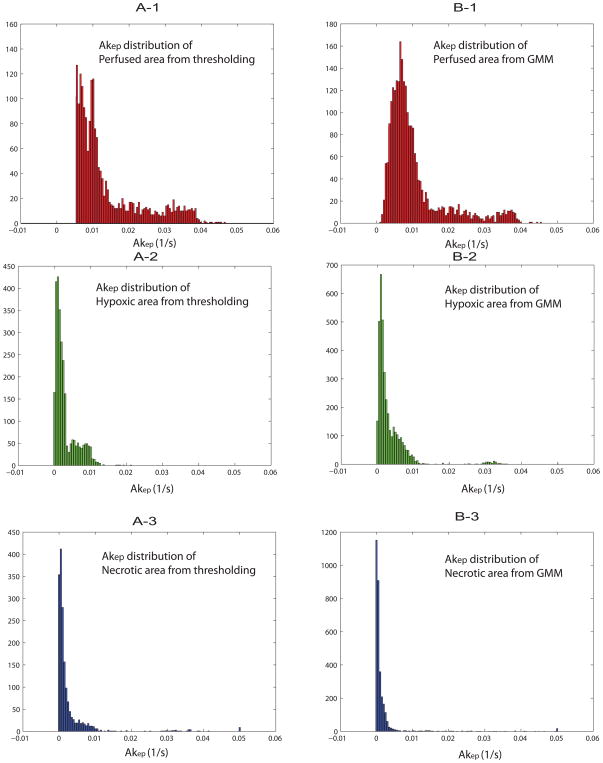
Fig. 6.
Akep distributions of each tumor segmentation for perfused (A-1), hypoxic (A-2) and necrotic (A-3) regions from thresholding methods are shown. Corresponding Akep distribution from GMM classification of perfused (B-1), hypoxic (B-2) and necrotic (B-3) regions are shown as well. Data from six rats were combined for the analysis.

