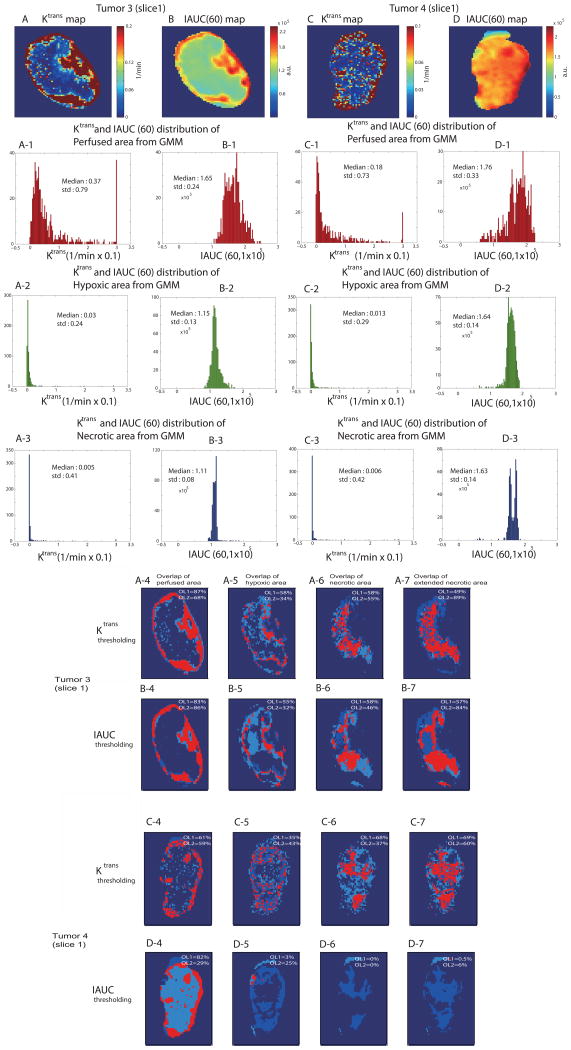
Fig. 7.
Ktrans map (A) and IAUC(60) map (B) of tumor 3(slice1) are shown. Corresponding distribution of Ktrans and IAUC(60) values for GMM-classified perfused (A-1, B-1), hypoxic (A-2, B-2) and necrotic (A-3, B-3) regions are shown, respectively. The Ktrans map (C) and IAUC(60) map (D) of tumor 4 (slice1) are shown. Corresponding distribution of Ktrans and IAUC(60) values for GMM-classified perfused (C-1, D-1), hypoxic (C-2, D-2) and necrotic (C-3, D-3) region are shown, respectively as well. An overlap analysis between each compartmentation from Ktrans thresholding and ‘standard’ methods (i.e, pimonidazole, H&E) is shown for perfused (A-4, C-4), hypoxic (A-5, C-5), necrotic (A-6, C-6) and extended necrotic (A-7, C-7) areas for both tumors. An overlap analysis between each compartmentation from IAUC thresholding and ‘standard’ methods is shown for perfused (B-4, D-4), hypoxic (B-5, D-5), necrotic (B-6, D-6) and extended necrotic (B-7, D-7) areas for both tumors as well. For each segmentation: OL1=(number of overlapping voxels)/(total number of thresholded voxels from standard images). OL2=(number of overlapping voxels)/(total number of Ktrans/IAUC thresholding classified voxels).

