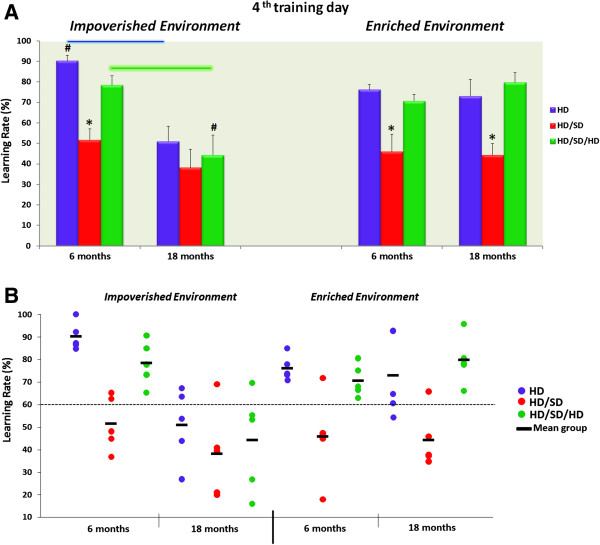
Figure 1.
Learning rate on water maze test under different diet regimes, ages, and environments. Graphic representation of diet regime, age, and environmental influences on learning rate of the best five performances of each experimental group on the fourth training day. In the top panel (A), indicated in different colours, are the mean values and standard errors of the learning rates with respective significance values, and in the bottom panel (B) are the individual performances (coloured, solid circles) and mean groups (dark dashes between solid circles). (*) indicates significant differences in learning rates between different diet regimes, (#) significant differences in learning rates between environments, and coloured line connectors differences in learning rates between age.

