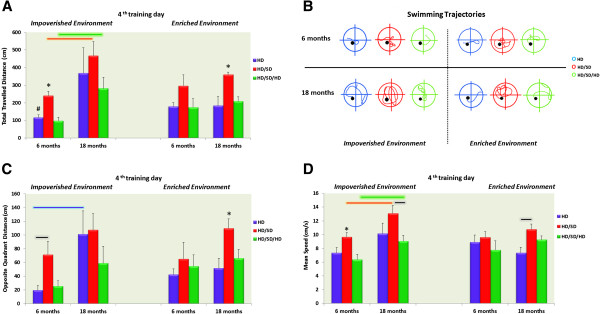
Figure 2.

Total and opposite quadrant travelled distances, representative swimming trajectories, and swimming speed. In the top panels, indicated in different colours, are the mean values and standard errors of the total distances (A) and representative swimming trajectories of each group of animals closer to the mean distance group (B). In the bottom panels are the mean values of opposite quadrant distances (C) and swimming speeds (D). All data plots are expressed as a function of age, environment, and diet regimes. As expected, HD/SD groups, independent of age or environment, swam longer distances both in total and in the opposite quadrant than all other groups. (*) indicates significant differences between different diet regimes, (#) significant differences between environments, and coloured line connectors differences between ages, and the edges of the black line link differences between diet.
