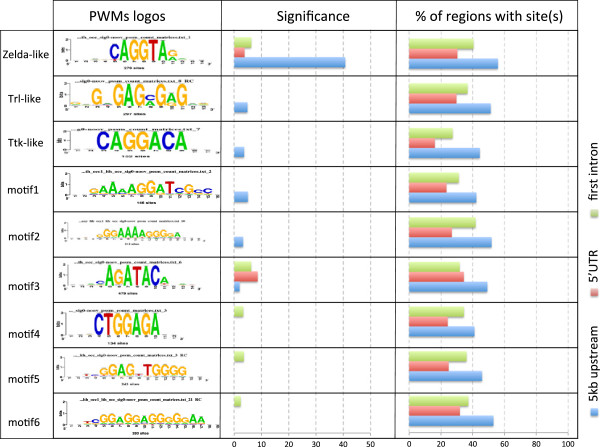
Figure 5.
Selection of the most representative motifs discovered in ZGA non-coding sequences. Each row represents one discovered motif, represented by its logo. Correspondences with motifs bound by known factors are indicated on the left. For each sequence type (5 kb: 5 Kb upstream TSS, 5’UTR, intron1: first intron), we indicated the significance (“Sig” column), the proportion of region containing at least one occurrence of the motif (“%r / s” column).

