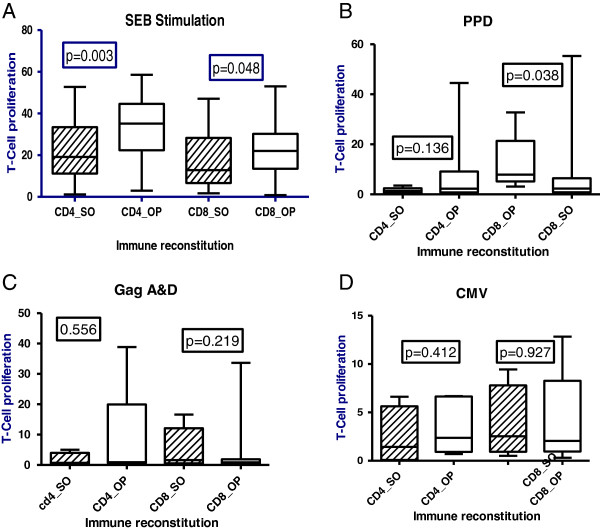
Figure 4.
CD4 and CD8 T-cell proliferation up stimulation by SEB, PPD, GagA&D and CMV antigens respectively; among suboptimal (SO) relative to optimal (OP) immune responders after 4 years of suppressive antiretroviral therapy. Panel A shows lower CD4 and CD8 proliferation among suboptimal relative to optimal responders upon SEB stimulation, Panel B shows lower CD8 proliferation among suboptimal relative to optimal responders upon stimulation with tuberculin PPD, Panel C shows lower CD4 proliferation upon stimulation with Gag A & D although the difference is not statistically significant and Panel D shows lower CD4 proliferation upon stimulation with CMV although the difference is not statistically significant.

