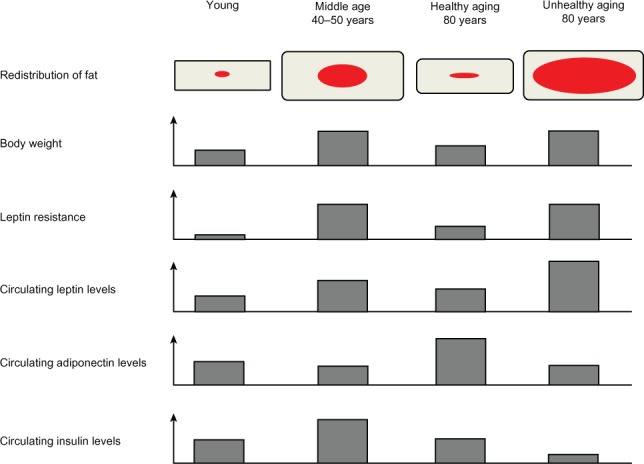
Figure 2.

Representation of the different modifications regarding the redistribution of body fat, body weight, leptin resistance, and circulating levels of leptin, adiponectin, and insulin in conditions of youth, middle age, healthy aging, and unhealthy aging. Red and grey represent visceral and subcutaneous adipose tissue, respectively.
