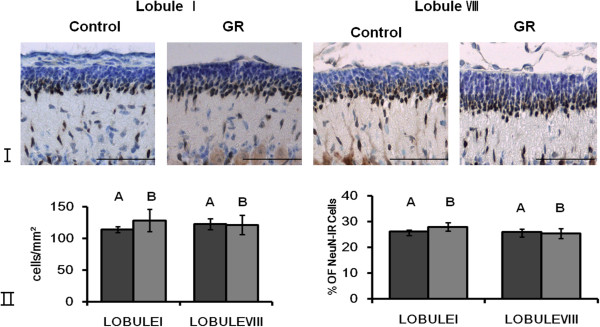
Figure 1.

Representative photomicrographs of NeuN-IR cells in the EGL at 50 dg. (I) NeuN-IR cells were located at the bottom of the EGL. Scale bars= 100 μm. (II) The density and proportion of NeuN-IR cells in the EGL of lobule I and lobule VIII from controls and GR fetuses at 50 dg (A: Control B: GR). The density and proportion of NeuN-IR cells in the EGL did not differ significantly between control and GR fetuses. Values are expressed as a Mean ± SEM. (p > 0.05).
