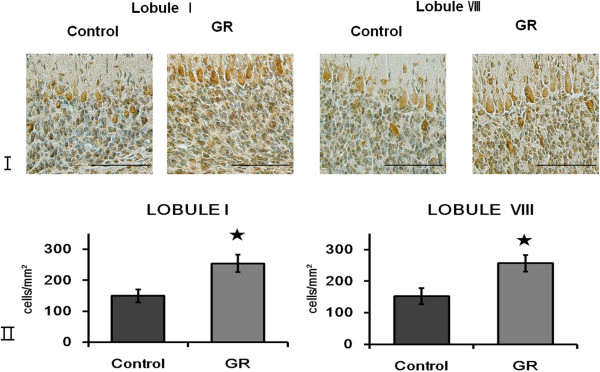
Figure 3.

Expression of Hif1α in the IGL at 50 dg. (I) Hif1α Immunoreactivity in the IGL of lobule I and VIII from a control and a GR fetus at 50 dg. Scale bars= 100 μm. (II) The density of Hif1α-IR cells in the IGL of lobule I and lobule VIII from controls and GR fetuses at 50 dg. The density of Hif1α-IR cells was greater in the GR fetuses than in the controls. Values are expressed as a Mean ± SEM. ★ p<0.05.
