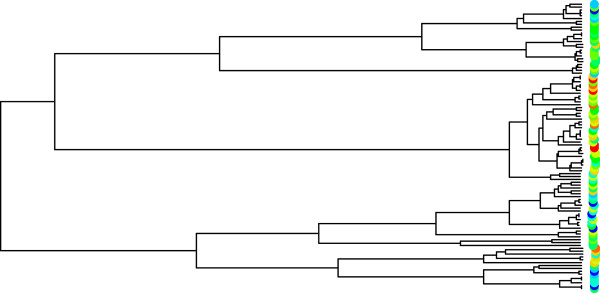
Figure 1.

Phylogenetic tree at an associated SNP. This tree shows the evolutionary history of a SNP for 50 diploid observations of a quantitative trait (colored circles on right). The low values of the trait are blue, and the high values are red. The clustering pattern shown by the tree is an indication of the association between the SNP and the trait.
