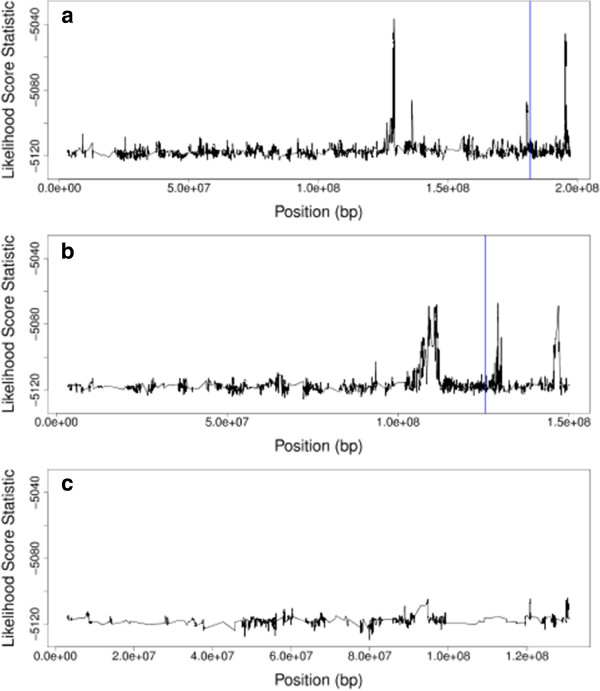
Figure 5.

Likelihood score statistic plot. For the analysis of the HDL level in mice, this plot shows LSS plotted against the location of the SNP in DNA base pairs along Chromosomes 1, 5, and 8 in plots (a), (b), and (c), respectively. The vertical lines represent locations detected as highly significant by Zhang et al. [15].
