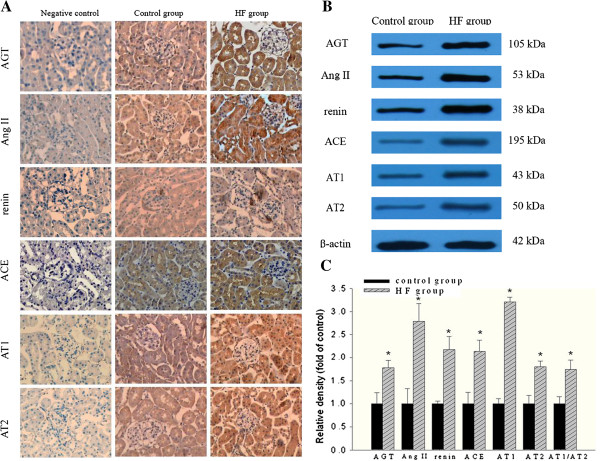
Figure 3.
Protein expressions of intrarenal RAS components in two groups of mice. (A) Immunohistochemical analysis of intrarenal RAS expression position in the two groups of mice. AGT immunoreactivity in the proximal tubular cells, Ang II immunoreactivity in both glomerular and tubular cells, renin immunoreactivity in juxtaglomerular apparatus cells, ACE immunoreactivity in brush border membranes of proximal tubules as well as AT1 and AT2 immunoreactivity in the proximal tubules were increased in the HF group when compared to the control group. (B) Western blot analysis for protein expressions of intrarenal RAS components in the two groups of mice. (C) The histogram represents mean ± SD of the densitometric scans for the protein bands of angiotensinogen (AGT), angiotensin II (Ang II), renin, angiotensin converting enzyme (ACE), angiotensin II type 1 receptor (AT1), angiotensin II type 2 receptor (AT2) from five experiments, normalized by β-actin. * P < 0.05 vs. control.

