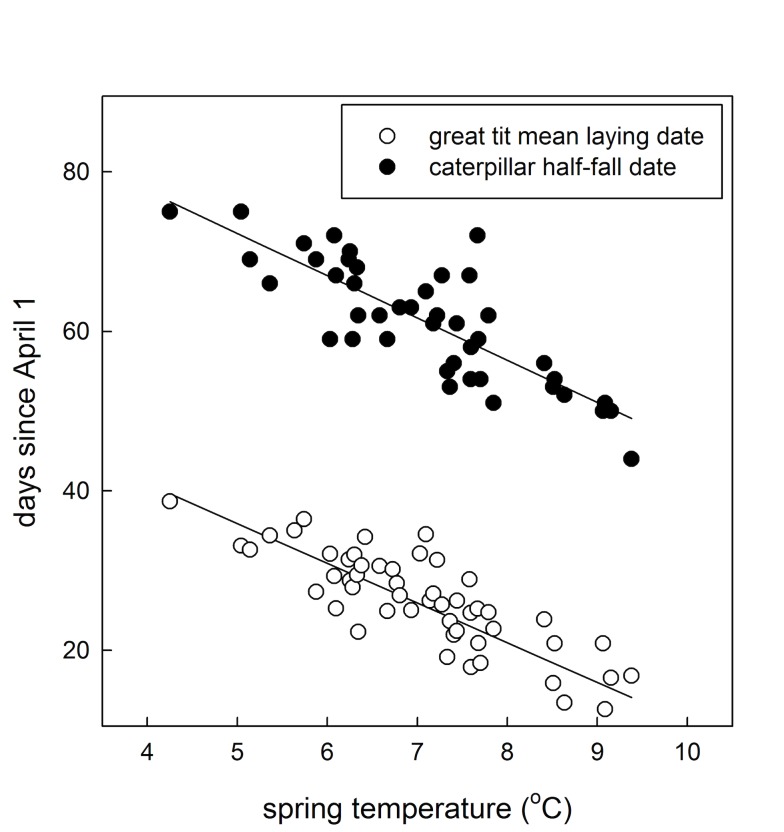
Figure 1. Annual mean great tit laying date and annual caterpillar half-fall date in Wytham Woods plotted against spring temperature.
The trend line for laying date represents the average within-individual response to spring temperature (see Results). The trend line for half-fall date represents the average response to spring temperature.

