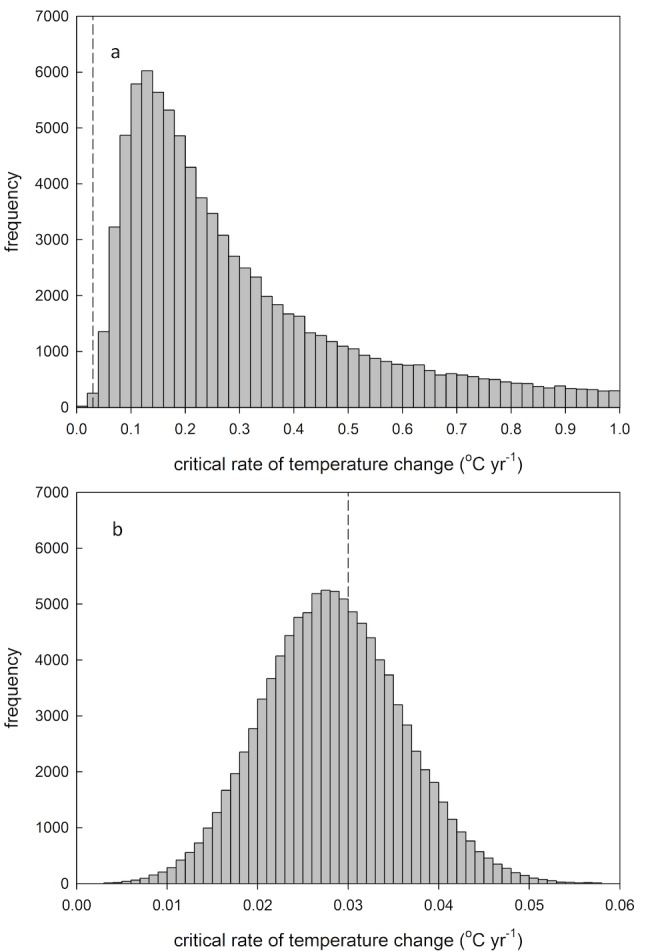
Figure 2. Frequency distribution of model predicted critical rate of temperature change that allows population persistence (η c) , (a) based on 100,000 simulations randomly sampling from error distributions of parameters σ2h2, γ, T, B and b, estimated for great tits in Wytham Woods (see Table 1).

The dashed vertical line represents the predicted rate of local temperature change, under the high emissions scenario [25]. Note that the distribution is highly skewed, with the modal outcome being biased to lower values of η c and a long tail of high values of η c (for visual purposes the x-axis was cut off at η c = 1.0). This is because the difference between the reaction norm of great tit laying date in response to spring temperature (b) and the optimal reaction norm (B) is modelled in absolute terms while in the simulations b often exceeds B, causing the average outcome of |B−b| to be higher than the outcome for the point estimate. (b) Frequency distribution of η c, based on 100,000 simulations randomly sampling from error distributions of parameters σ2h2, γ, and T, assuming there is no phenotypic plasticity (for this population, |B−b| = 5.30). The dashed vertical line represents the predicted rate of local temperature change, under the high emissions scenario [25]. Note that the scale on the x-axis differs between the two figures.
