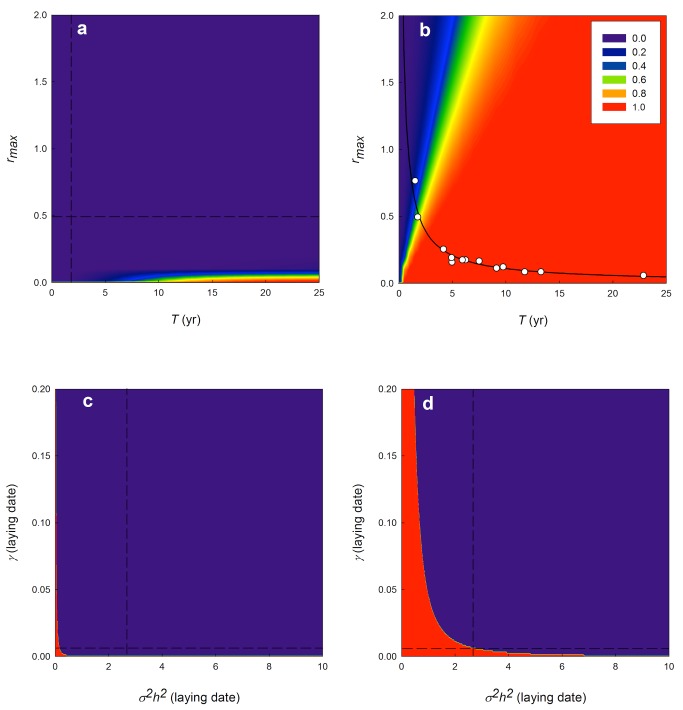
Figure 3. Probability of population extinction (η c<0.030), based on 100,000 simulations incorporating the error distribution of parameter estimates, plotted for (a) rmax and T, assuming the observed phenotypic plasticity (|B−b| = 0.32), (b) rmax and T, assuming there is no phenotypic plasticity (|B−b| = 5.30), (c) γ and σ2h2 (for laying date) assuming the observed phenotypic plasticity (|B−b| = 0.32), (d) γ and σ2h2 (for laying date) assuming no phenotypic plasticity (|B−b| = 5.30).
Open circles and solid trend line in (b) represent estimates for rmax and T of 13 bird species, and their derived interrelationship (rmax = 0.92T −0.92), illustrating a general life-history pattern in birds [28]. The dashed lines in (a, c, and d) represent the estimated values for the parameter on the axis, for Wytham Woods' great tits (see Table 1).

