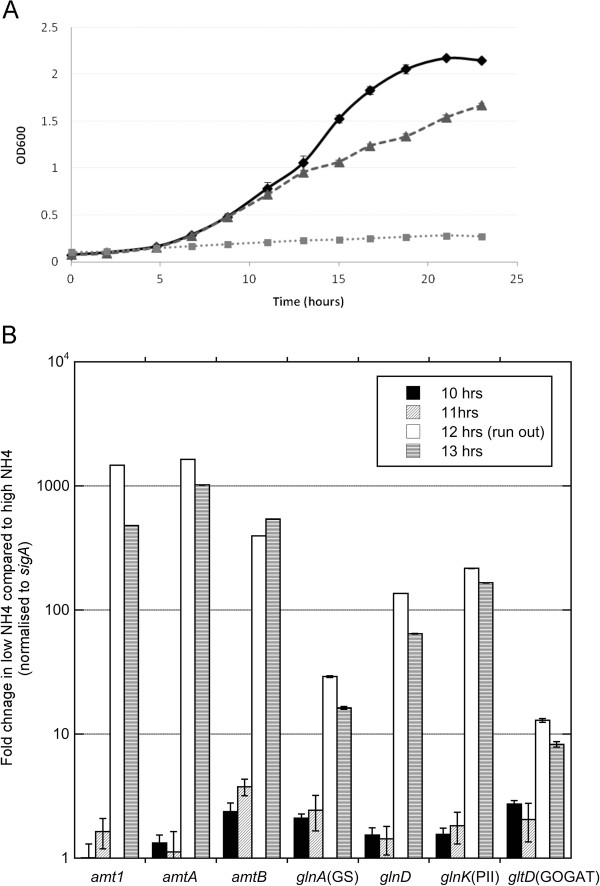
Figure 1.
The transcriptional response and growth of M. smegmatis under different nitrogen conditions. (A) Growth of M. smegmatis in 0 mM (closed squares), 1 mM (closed triangles) and 30 mM (closed diamonds) ammonium sulphate (n = 3) (B) Average fold change in transcript levels for amt1, amtA, amtB, glnD, glnK, gltD and glnA1 during nitrogen limitation compared to nitrogen excess (n = 3). Expression data was normalised to sigA. Error bars represent SD. Significant induction of nitrogen stress response is observed at 12 hours.

