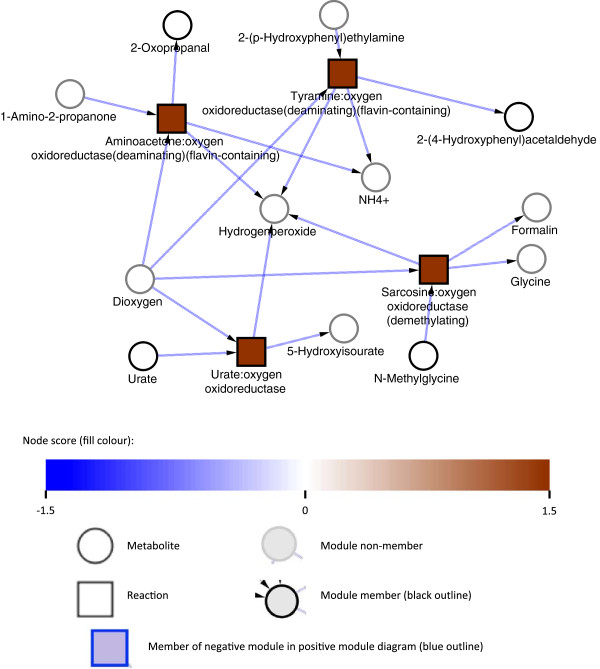
Figure 4.
Regulation of hydrogen peroxide metabolism in response to nitrogen stress. Metabolic modules uHP representing hydrogen peroxide metabolism consisting of 6 reactions and 1 metabolite with a combined score of 9.77 and a q-value < 1e-5. Squares represent enzymatic reactions and circles represent metabolites. No definitive claims can be made about fluxes, so arrows are only indicative and taken from the identity or context of the relevant reaction.

