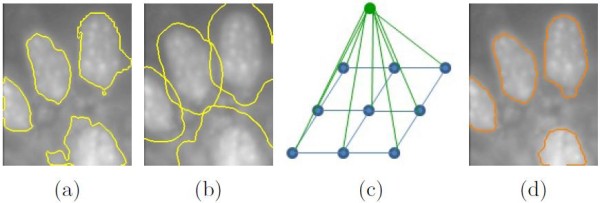
Figure 5.

Illustration of contour refinement.(a) Segmentation output after the decluster processing shown with yellow contours. (b) indicated with yellow contours. (c) Visualization of the graphical model, with blue nodes representing li and green node lG, and the blue and green edges denoting the pairwise relationships. (d) Results of contour refinement with orange contours.
