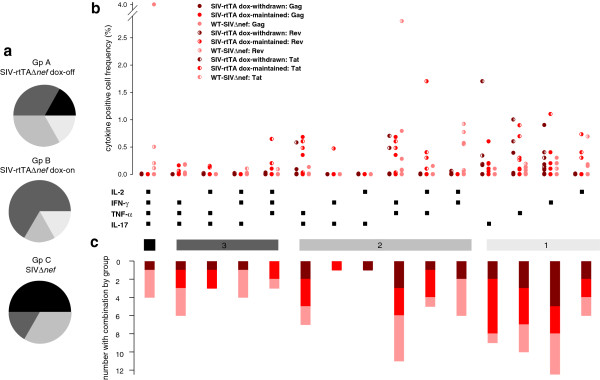
Figure 6.

Intracellular cytokine staining of SIV-specific CD4+ peripheral blood T cells. Cell populations were determined by multiparametric flow cytometry. All analyses were performed at the end of the experimental infection schedule for each group of SIV-infected macaques. Pie charts show the proportion of animals in each group with maximum polyfunctionality regardless of which SIV peptide pool was recognised (a). Maximum polyfunctionality (4 parameter) is shown in black and descending degrees of polyfunctionality in shades of grey. Scatter charts show the frequency distribution for each SIV peptide pool (different symbols) and the degree of polyfunctionality for animals of each group (different colours) (b). Group A is shown in dark red, Group B in red and Group C in pink. Stacked bars show the number of animals in each group of 6 animals responding with each combination of cytokines (c).
