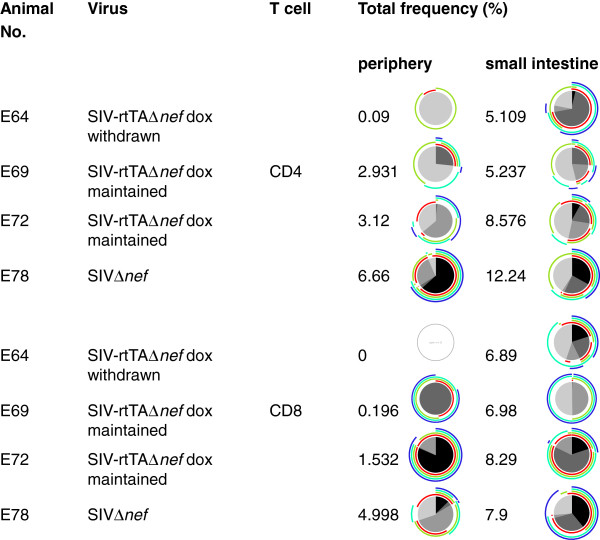
Figure 8.
Comparison of frequencies of SIV-specific T cells in the circulation and small intestine. Pie charts show the proportion of cells expressing 4, 3, 2 or 1 cytokine with maximum polyfunctionality shown in black followed by shades of grey. Arcs show individual cytokine combinations. IL-2 - red; IFN gamma - green; TNF-alpha - turquoise; IL-17 - blue.

