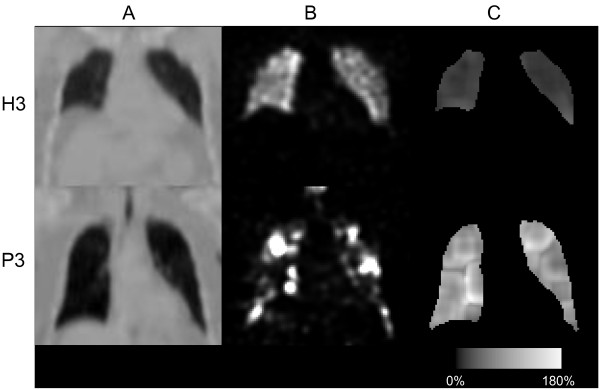
Figure 8.

Reconstructed images and CV matrices for healthy volunteer H3 and patient P3. One row for healthy volunteer H3 and one row for patient P3, showing (A); coronal slices of the attenuation map, (B); a filtered reconstruction and, (C); corresponding CV matrix.
