Figure 1.
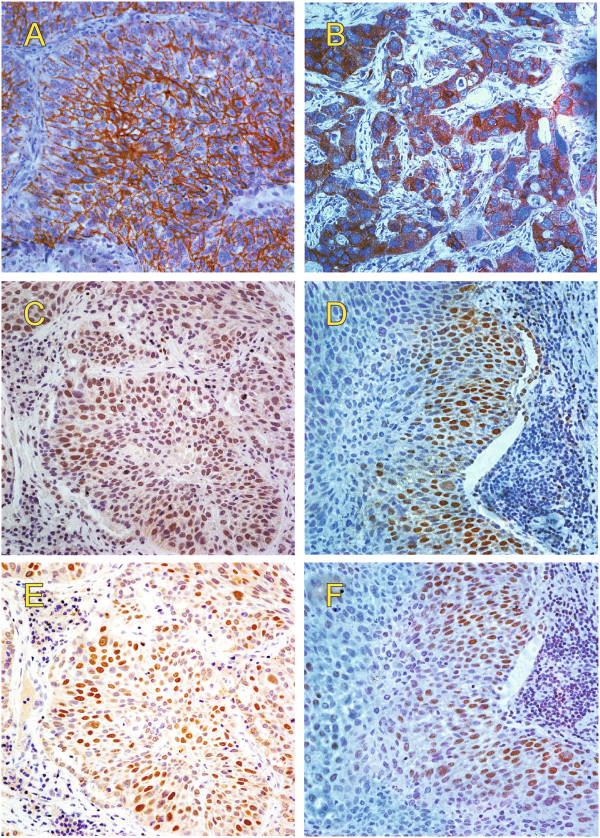
IHC staining for β-catenin and Nanog expression in NSCLC. Representative images of intracellular β-catenin expressed at the membrane (A), in cytoplasma (B) or in the nucleus (C and D). In serial sections, Nanog staining (E and F) frequently overlapped with β-catenin staining (C and D) in the nuclei of most cells.

