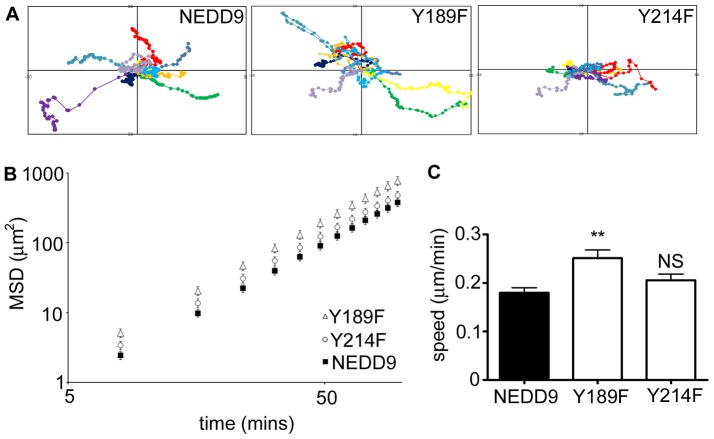
Figure 3. Mutation of NEDD9Y189 stimulates faster cell migration.
A. 10 representative migration traces of NEDD9−/− fibroblast cells transfected with the indicated GFP expression plasmids. B. MSD calculated from trajectories of cells expressing exogenous NEDD9 (black squares), NEDD9 Y189F (white triangles) and Y214F (white circles). C. Average speed of NEDD9−/− fibroblasts transfected with the indicated GFP expression plasmids. Graphs show the average (n>50 cells per expression construct) and SEM. **p<0.01, NS = not significant.

