
Figure 1.
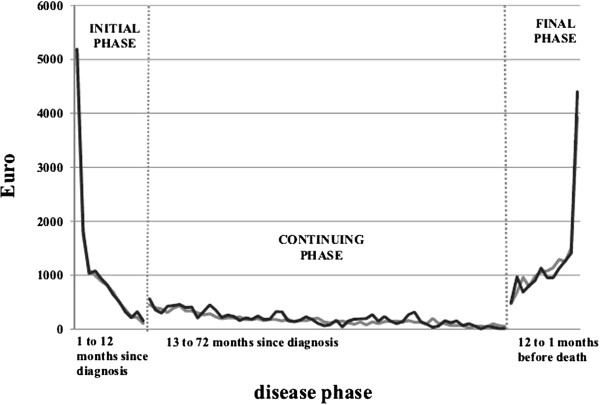
Average costs (€) per month of colorectal cancer patients by phase of care. The figure shows the dynamic along the disease pathway of the average reimbursement (in Euros) allocated to hospitals per patient/per month (y-axis) in each phase of the disease of the 2000-2001 cohort of colorectal cancer cases diagnosed in LHU-Padua and TCR respectively. In the initial and continuing phases the x-axis measures the time occurred since diagnosis, in the final phase the x-axis measures the time since entrance in the final phase (starting from the twelfth up to the first month since entrance). The black line represents the LHU-Padua, the gray line represents the TCR.