
Figure 2.
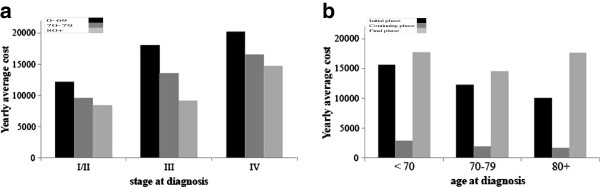
Average yearly costs (€) of colorectal cancer patients for VCR and TCR combined. a. The histogram illustrates the distribution of the average yearly costs (in Euros) of the initial phase in the 2000-2001 cohort of colorectal cancer cases diagnosed in VCR and TCR combined, by stage at diagnosis (x-axis) and age class (dark bar represents 0-69, gray bar represents 70-79, light gray bar represents 80+). b. The histogram illustrates the distribution of the average yearly costs (in Euros) in the 2000-2001 cohort of colorectal cancer cases diagnosed in VCR and TCR combined, by age at diagnosis (x-axis) and phase of care (dark bar represents the initial phase, gray bar represents the continuing phase, light gray bar represents the final phase).