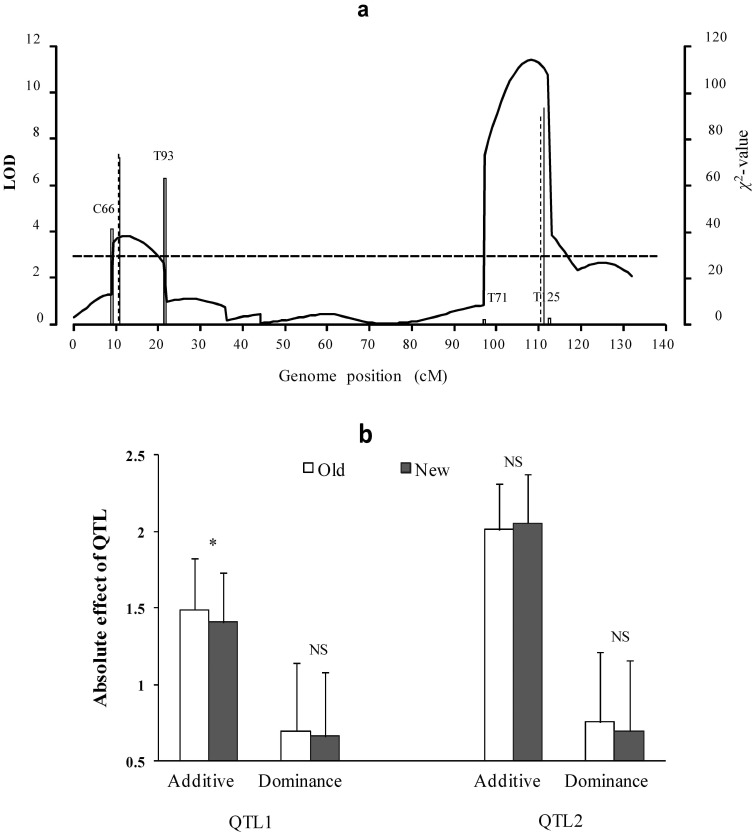
Figure 4. Mapping QTL for weight in 333 mouse F2 individuals.
(a) LOD scores using composite interval mapping (CIM, curve), old (solid vertical line) and new (dashed vertical line) methods. Dashed horizontal line represents critical value for significant QTL. Hollow vertical line indicates  value of segregation distortion test for marker interval of QTL; (b) QTL absolute effects, detected by old and new methods. NS and star indicate no difference and significant difference at the 0.01 level between old and new methods, respectively.

