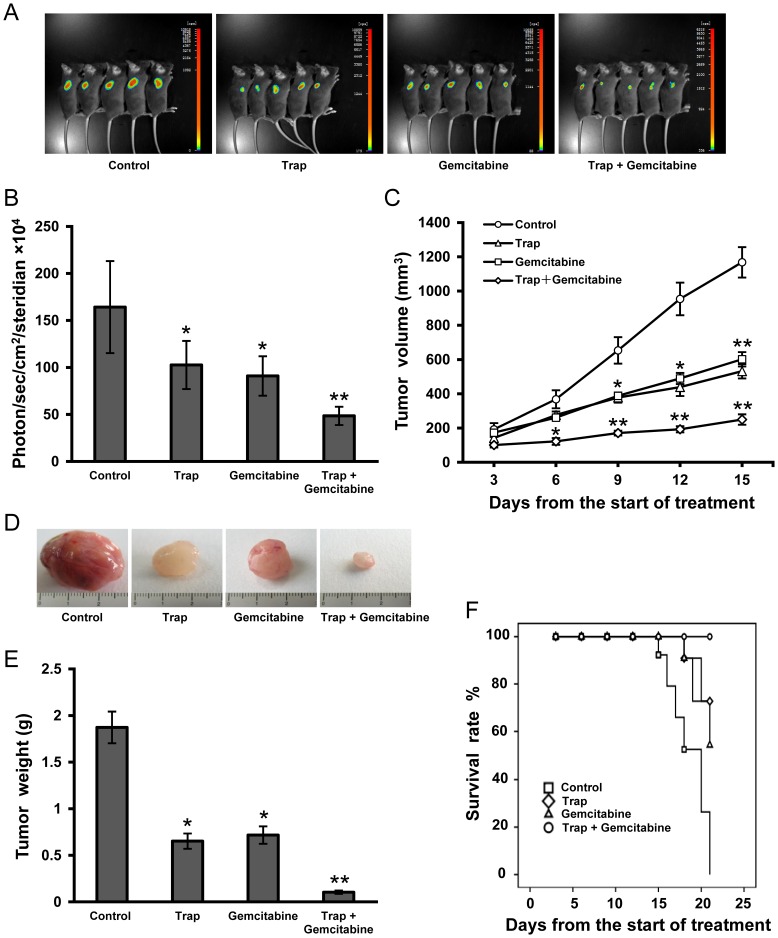
Figure 2. Anti-tumor effects of combination therapy with VEGF-Trap and gemcitabine in LLC tumor model.
(A) Bioluminescence images of subcutaneous inoculated LLC tumors on day 12 after the start of treatment; (B) Imaging analysis (photons per second) depicting the tumor volumes of mice using the IndiGo imaging analysis software; (C) Tumor volume calculated on day 3, 6, 9, 12,15 after the start of treatment; (D) Representative tumor photos on day 15 after the start of treatment; (E) Tumor weights were measured on day 15 when tumors were harvested; (F) Survival curves were constructed according to the Kaplan-Meier analysis. n = 8 for each group, *P<0.05, **P<0.01 vs the control group.

