
Figure 3. Spatial patterns of temporal patterns.
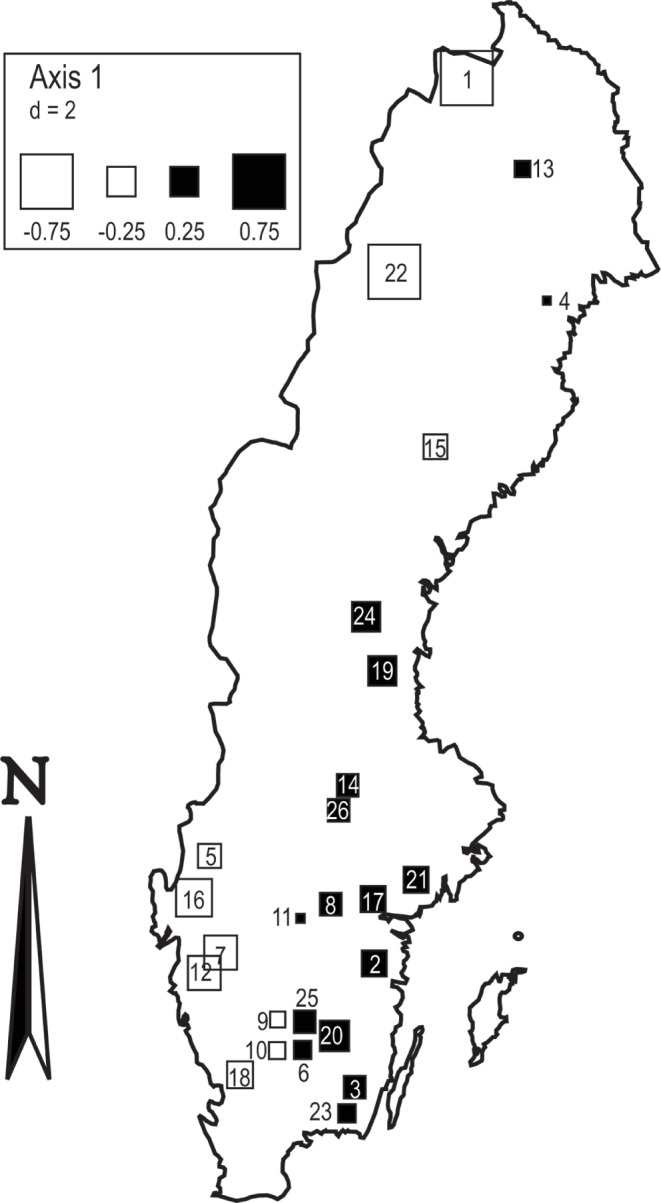
Result from spatial analysis showing broad-scale spatial structure of invertebrates in the time-explicit metacommunity analysis. The size of the symbols are proportional to the lower-order PCNM vectors that describe this spatial structure and the color represents the sign (white = negative, black = positive). Numbers within squares refer to lake identity: 1, Abiskojaure; 2, Allgjuttern, 3, Brunnsjön; 4, Brännträsket; 5, Bysjön; 6, Fiolen; 7, Fräcksjön; 8, Grissjön; 9, Hagasjön; 10, Harasjön; 11, Humsjön; 12, Härsvatten; 13, Jutsajaure; 14, Mäsen; 15, Remmarsjön; 16, Rotehogstjärnen; 17, Skärgölen; 18, Stora Skärsjön; 19, Stensjön; 20, Storasjö; 21, Stora Envättern; 22, Stor-Tjulträsket; 23, Sännen; 24, Tväringen; 25, Älgarydssjön; 26, Övre Skärsjön.