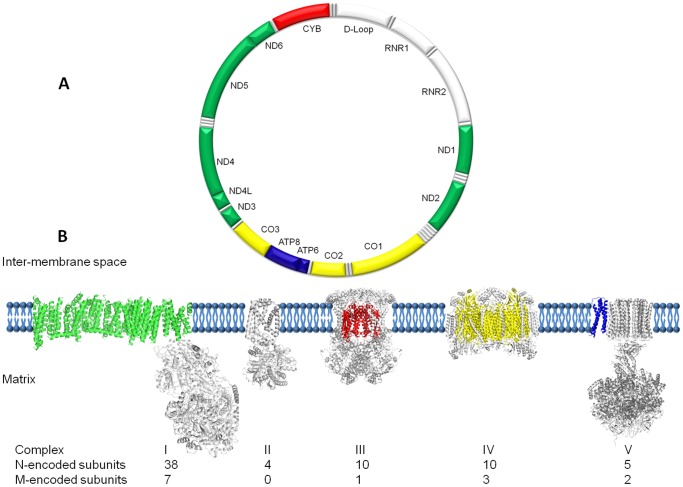
Figure 1. Architecture of the mitochondrial genome and respiratory chain.
(A) Schematic representation of the 16,569 bp human mitochondrial genome (NC_012920), with the protein-coding genes colored according to the complexes to which they contribute subunits, two ribosomal RNAs, 22 tRNAs and non-coding D-loop in white. (B) Montage depicting the structural information currently available for the five complexes that together contribute to the mitochondrial oxidative phosphorylation machinery. Each complex (to scale) is embedded in a cartoon representation of the lipid bilayer with the mitochondrial (m)-encoded subunits colored corresponding to the genome diagram. The nuclear (n)-encoded subunits are shown in grey with the relative contributions found in higher organisms detailed below.

