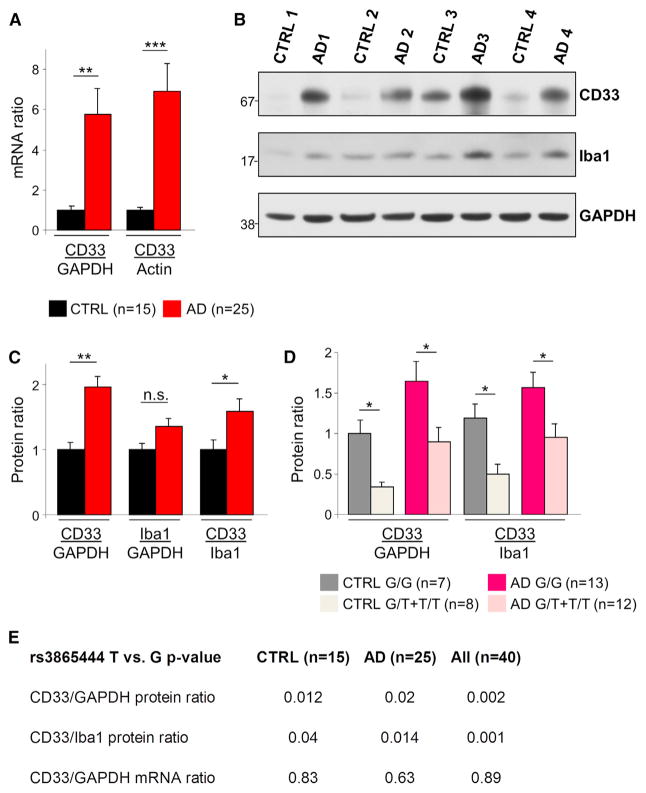
Figure 1. Increased CD33 Expression in AD.
(A) Quantitative real-time PCR analysis of CD33 expression in the frontal cortex reveals increased CD33 mRNA levels in AD relative to control subjects; CD33 mRNA levels have been normalized to GAPDH or β-Actin mRNA.
(B) Western blotting detection of CD33 in the frontal cortex reveals a marked upregulation in AD cases relative to age-matched controls. A less pronounced increased expression is also seen for Iba1. GAPDH served as loading control.
(C) The CD33/GAPDH and CD33/Iba1 protein ratios are increased in AD patients relative to age-matched controls.
(D) The levels of CD33 protein are decreased in carriers of the protective minor (T) allele of the CD33 SNP rs3865444. Bar graph shows CD33 protein levels in individuals from the indicated groups (CTRL or AD) and genotypes (G/G versus G/T or T/T). For (A)–(D), *p < 0.05, **p < 0.01, ***p < 0.001, Student’s t test. Data are represented as mean ± SEM.
(E) Analysis based on general linear regression model reveals that the protective minor (T) allele of rs3865444 is associated with decreased CD33 protein, but not mRNA levels, in both controls and AD cases (p < 0.05 was considered statistically significant). See also Figure S1 and Table S1.

