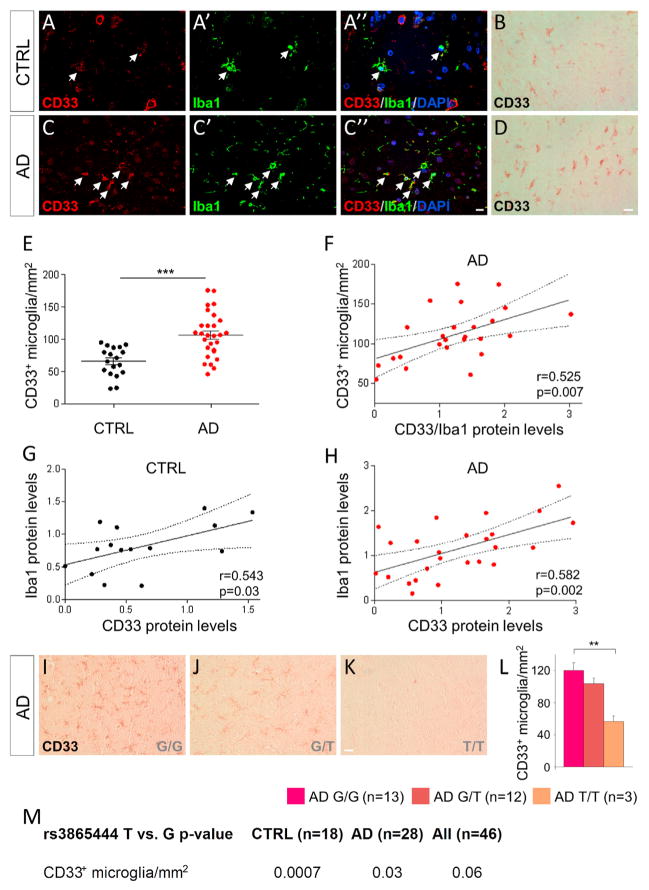
Figure 2. Increased Number of CD33-Immunoreactive Microglia in AD.
(A–A″ and C–C″) Fluorescent immunolabeling reveals colocalization between CD33 (red) and the microglial marker Iba1 (green) in the frontal cortex of CTRL (A–A″) and AD (C–C″) subjects.
(B and D) CD33 labeling using diaminobenzidine reveals numerous microglial cells that are positive for CD33.
(E) Stereology-based quantification reveals increased numbers of CD33-positive microglial cells in the frontal cortex of AD cases (n = 28) relative to controls (n = 18), ***p < 0.001, Student’s t test.
(F) CD33 protein levels normalized to Iba1 protein levels positively correlate with the numbers of CD33-immunoreactive microglia in the AD cases (n = 25; r = 0.525; p = 0.007, Pearson’s correlation test).
(G and H) CD33 protein levels correlate with the levels of the microglial marker Iba1, both in controls (G; n = 15; r = 0.543; p = 0.03, Pearson’s correlation test) and AD (H; n = 25; r = 0.582; p = 0.002, Pearson’s correlation test) cases.
(I–K) Carriers of the protective minor (T) allele of rs386544 exhibit decreased numbers of CD33-positive microglia. Shown are representative pictures from the frontal cortex of a G/G carrier (I), G/T carrier (J), and T/T AD carrier (K), stained for CD33.
(L) Stereology-based quantifications reveal reduced numbers of CD33-positive microglia in carriers of two protective (T) alleles of rs3865444 (**p < 0.01 T/T carriers versus G/G carriers, one-way Kruskal-Wallis ANOVA, Dunn’s test). Data are represented as mean ± SEM. Scale bars represent 25 μm.
(M) The protective (T) allele of rs3865444 is associated with decreased numbers of CD33-immunoreactive microglia in both controls and AD cases (general linear regression model, p < 0.05 was considered statistically significant). See also Figure S2.

