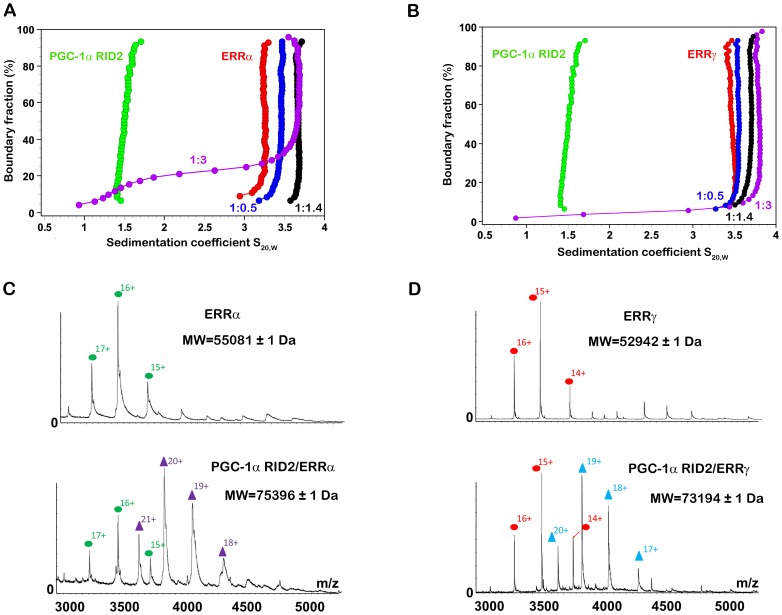
Figure 3. Biophysical characterization of the stoichiometry of the PGC-1α RID2/ERR complexes.
A and B. SV-AUC experiments for a titration series of increasing molar ratio of PGC-1α RID2 with respect to (A) ERRα and (B) ERRγ LBD dimer. G(S20,w) distributions are shown over the entire boundary for free PGC-1α RID2 (green), free ERR LBD (red) and for the titration series with ERR LBD:PGC-1α RID2 ratios 1∶0.5 (blue), 1∶1.4 (black) and 1∶3 (magenta). The excess of PGC-1α RID2 in the 1∶3 data is seen as a shoulder extending to values close to that of free PGC-1α RID2. In the experiments with ERRγ LBD, the concentration of PGC-1α RID2 was overestimated, as can be seen by the faint shoulder of the 1∶3 titration data. Thus the 1∶1.4 molar ratio is overestimated and as a consequence the corresponding data approach a limiting value of saturation given by the 1∶3 titration data. C and D. ESI mass spectra recorded under non-denaturing conditions in 200 mM ammonium acetate at pH = 7.4 for (C) ERRα LBD (top) and PGC-1α RID2/ERRα (bottom) and for (D) ERRγ LBD (top) and PGC-1α RID2/ERRγ complex (bottom). The different charge states of the proteins are indicated above the peaks and depicted for ERRα and ERRγ with green and red dots, respectively and for PGC-1α RID2/ERRα and PGC-1α RID2/ERRγ with magenta and blue triangles, respectively. For the measurements of ERRα complexes, the His6-tag of ERRα LBD was not cleaved, resulting in an increase of 3766 Da with respect to the molecular weight shown in Table S1.

