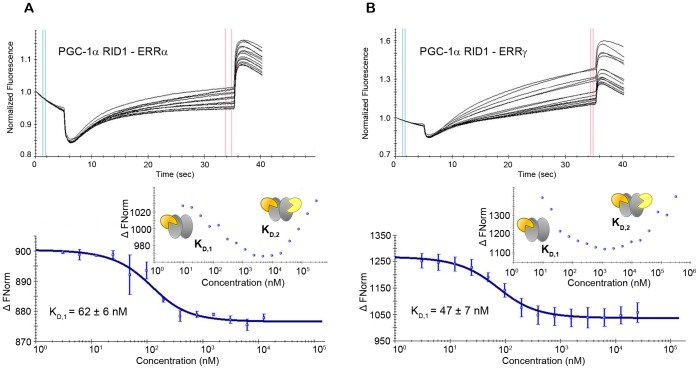
Figure 4. PGC-1α RID1 binding to ERRα and ERRγ measured by MST.
Unlabeled PGC-1α RID1 protein was titrated into a fixed concentration of (A) labeled ERRα LBD and (B) labeled ERRγ LBD. Top panels: raw thermophoresis data recorded at 20°C using the LED at 50% and IR-laser at 80%. Bottom panels: isotherms averaged over three consecutive measurements and fitted according to the law of mass action to yield the apparent KD,1. For the determination of KD,1, the concentration of unlabeled PGC-1α RID1 was varied between 30 µM and 3 nM, while the concentration of ERR LBD was kept fixed (50 nM). Insets: isotherms for titration series comprising higher unlabeled PGC-1α RID1 concentrations (300 µM to 10 nM) with a fixed ERR LBD concentration (20 nM), showing the two binding events of binding affinities KD,1 and KD,2.

