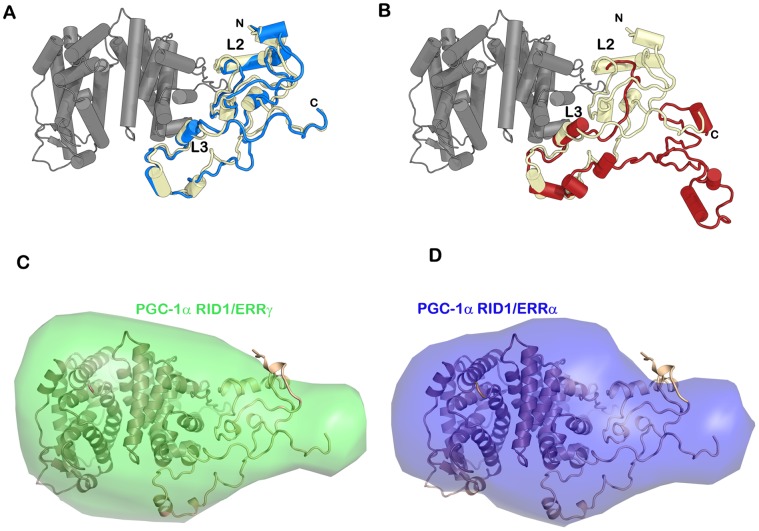
Figure 6. Solution structure of PGC-1α RID1/ERRγ and comparison with the ab initio envelope of PGC-1α RID1/ERRα.
A. and B. Schematic cartoon representations of the pseudo-atomic solution structures of the complex PGC-1α RID1/ERRγ. The Cα-trace of the PGC-1α RID1 molecule resulting from the rigid-body refinement is shown in light yellow. The N- and C-terminal ends and the positions of motifs L2 and L3, both of which corresponding to helices, are indicated. The Cα-trace of ERRγ LBD dimer is shown in dark grey (PDB entry 1KV6). A. One of the representative model obtained after relaxation using MD at moderate temperature is shown in blue. B. One of the representative model obtained along the trajectory of the higher temperature MD run is depicted in red. C and D. Molecular envelopes of the complexes PGC-1α RID1/ERRγ (green) and PGC-1α RID1/ERRα (blue) together with the pseudo-atomic solution structure of PGC-1α RID1/ERRγ shown in (A). The orientation of the models in C and D is identical to that in A and B.

