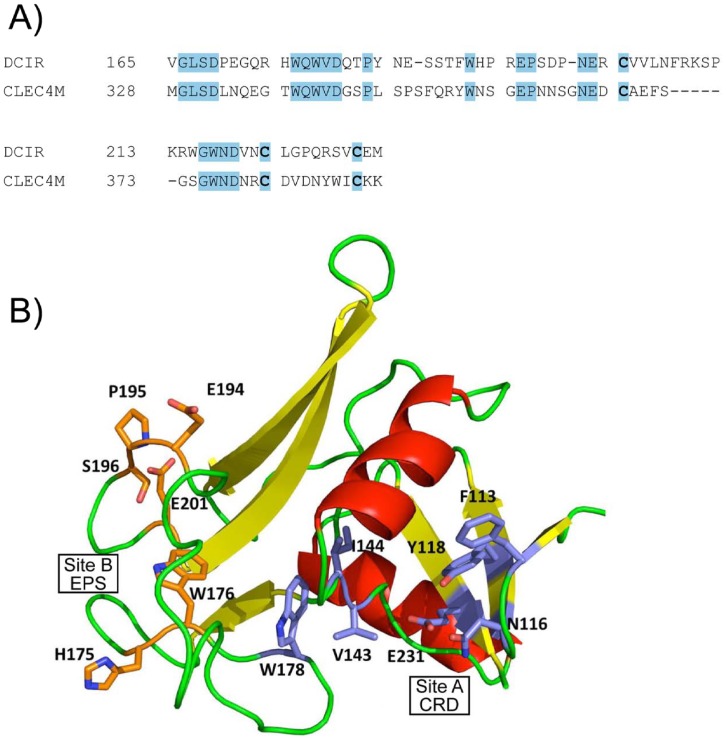
Figure 1. DCIR modelling.
A) Partial sequence alignment between CLEC4M (GenBank™ #AAI10615) and DCIR (GenBank™ # NP_057268) indicating completely conserved regions and residues. B) Three-dimensional model showing positions of the selected docking sites on the dendritic cell immunoreceptor (DCIR) model (103-233) for virtual screening runs according to the examples. Residues forming site A are represented by the blue portions while orange indicates those forming site B.

