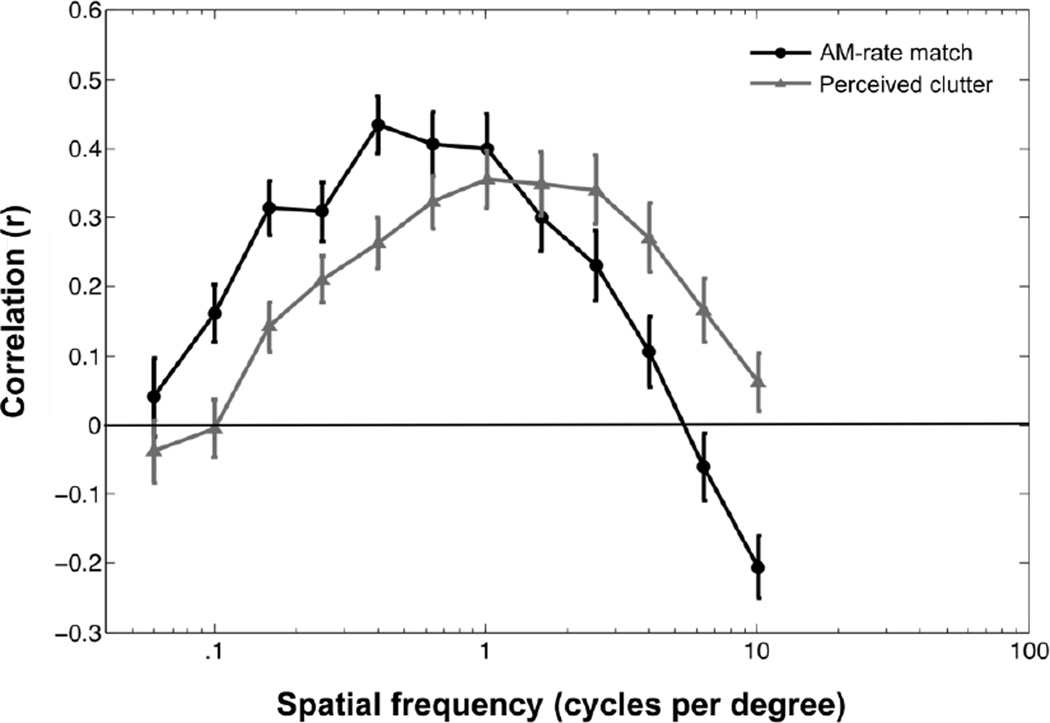
Figure 3.
Contributions of the contrast energy in each spatial-frequency bin to amplitude-modulation-rate (AM-rate) match and perceived clutter in Experiment 1. Each point represents the correlation (across images) between the contrast energy in each spatial frequency bin and the matched AM rate (black symbols) or the clutter rating (gray symbols). The error bars represent ± 1 SEM across participants.

