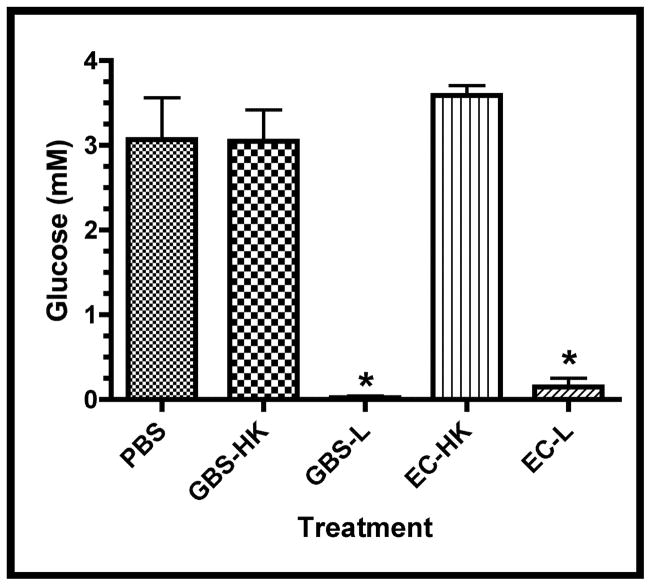
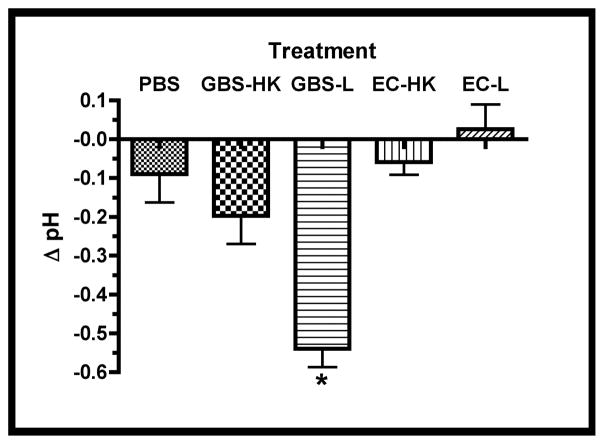
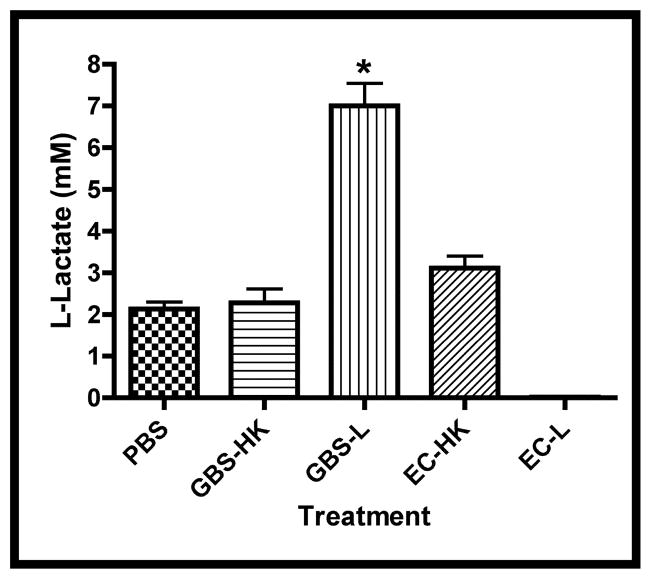
Figure 2. Infection-associated Media Changes.
Media changes including glucose concentration, pH changes (Δ pH), and L-lactate were measured in the spent media at the experimental termination (66.5 hrs.). A. Concentrations of glucose in treatment groups, asterisk indicates statistical significance for both GBS-L and EC-L with respect to the other samples (P < 0.001). B. Difference in spent media pH (Δ pH) between termination and initial values for treatment groups. Asterisk indicates statistical significance for GBS-L with respect to the other samples (P < 0.001). C. Concentrations of L-lactate in spent media subsequent to infections. Data points of all three graphs represent mean values from at least 5 independent experiments and error bars represent SEM.


