
Figure 6. Distribution of GBS and activated caspase-3 within fetal rat lung explants.
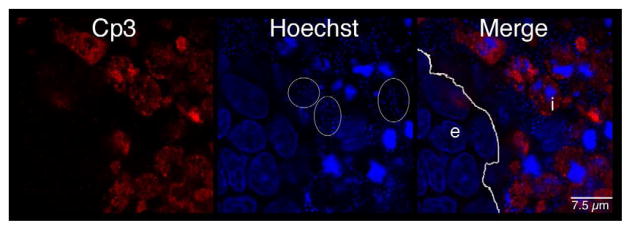

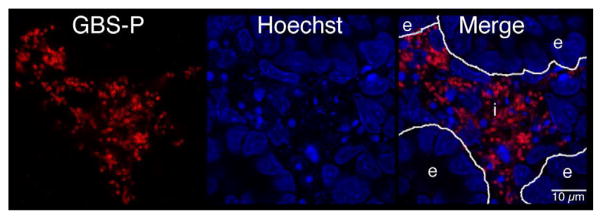

Fetal rat lung explants were infected with GBS as described above. A. Representative whole-mount confocal immunofluorescence image of active caspase-3 (red) in GBS-infected fetal rat lung explants. White line indicates the boundary between epithelium (e) and interstitium (i). B. Quantitative analysis of the distribution of the active form of caspase-3 (Cp3) between the epithelia and interstitium of fetal rat lung explants subsequent to live GBS infections. Data collected from representative images from four independent experiments (P < 0.0001). C. Representative confocal immunofluorescence image of GBS (red) detected with group B antigen-specific antibodies (GBS-P) in fetal rat lung explants. White lines demarcate tissue boundaries between epithelia (e) and interstitium (i). D. Quantitative analysis of the distribution of GBS between epithelia and the interstitium of fetal rat lung explants. Data collected from representative images of four independent experiments (P < 0.0001). Error bars are SEM. Hoechst is the nuclear counterstain (blue), which also detects GBS nucleoids (ovals).