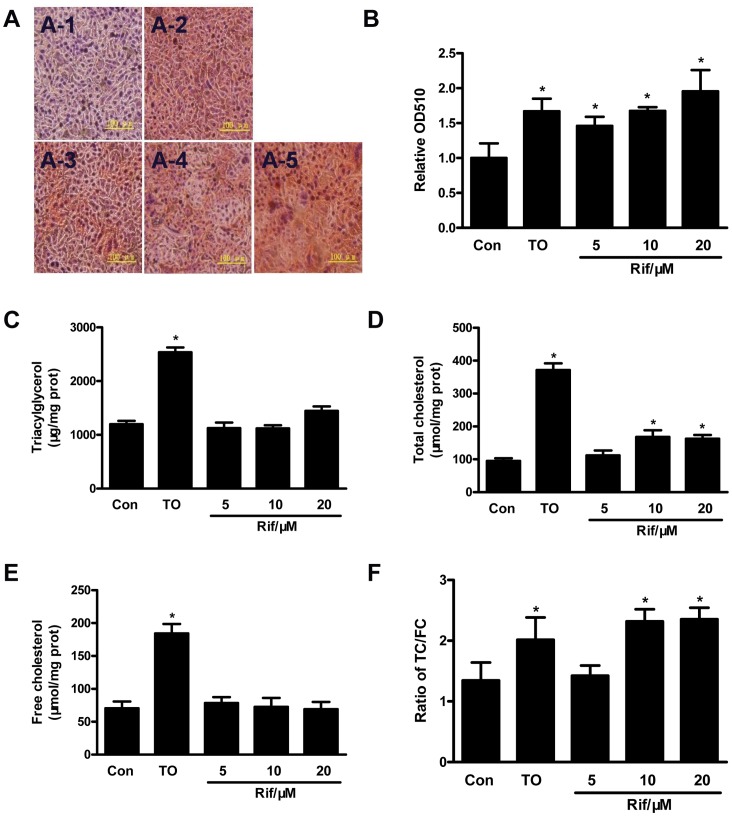
Figure 2. Rifampicin induced lipid accumulation in HepG2 cells.
A. Oil red O staining of HepG2 cells. HepG2 cells were treated with rifampicin 5 µM (A-3), 10 µM (A-4), 20 µM(A-5) or TO901317 (10 µM, A-2) for 48 h. Cells treated with DMSO (A-1) were used as control. B. The stained lipid content was quantified by measuring absorbance at 510 nm. The triglyceride (TG, C), total cholesterol (TC, D) and free cholesterol (FC, E) levels were measured. F. The ratio of TC/FC. All experiments were repeated at least three times. *, P<0.05.

