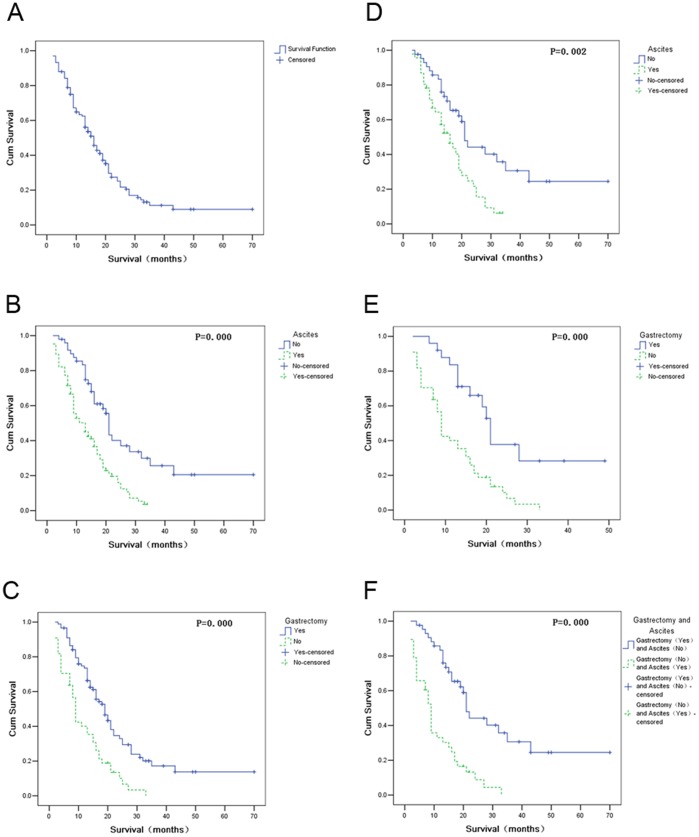
Figure 1. Survival curves of the whole population and subgroups according to prognostic factors.
(A) Overall survival curve of the total 133 patients. (B) Survival curves of the patients with or without ascites. (C) Survival curves of the patients who had or hadn’t undergone gastrectomy. (D) Survival curves of the patients with or without ascites in the subgroup of 89 patients who underwent gastrectomy. (E) Survival curves of the patients had or hadn’t undergone gastrectomy in the subgroup of 69 patients with synchronous ovarian metastasis. (F) Survival curves of patients who underwent gastrectomy and without ascites or patients who hadn’t undergone gastrectomy and with ascites.

