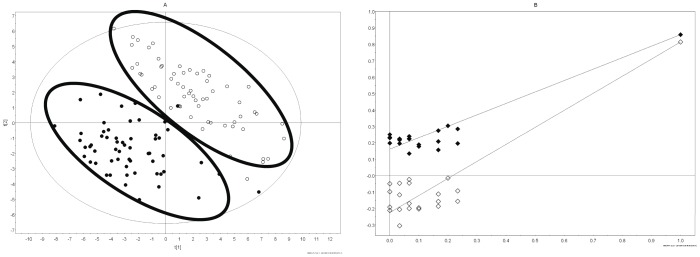
Figure 3. Comparison of metabolomic profiles between male and female IL-10 gene-deficient mice.
(A) Partial least squares-discriminant analysis (PLS-DA) of male (closed circle) versus female (open circle) IL-10 gene-deficient mice over all time points tested at weeks 4, 6, 8, 12, 16, and 20 demonstrate a gender separation in two distinct clusters. (B) Validation of the PLS-DA plot using 20 random permutations of the data revealed an R2Y value of 0.858 and a Q2 value of 0.813, indicating that separation observed in the PLS-DA model in Figure 3A did not occur by chance. (R2Y = closed diamonds, Q2 = open diamonds.).

