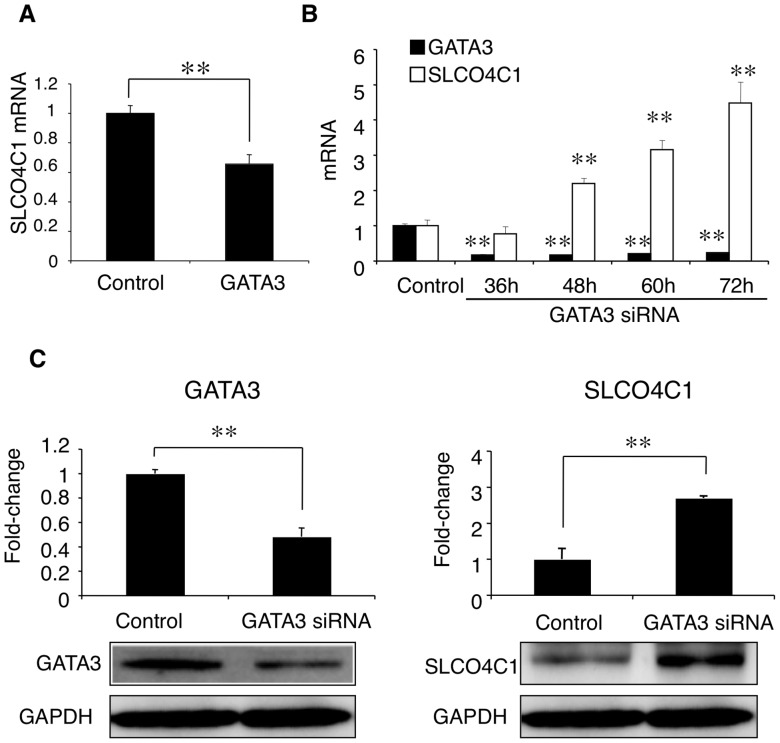
Figure 4. Negative regulation of GATA3 on SLCO4C1 expression.
(A) Overexpression of GATA3. (B and C) Knockdown of GATA3. (B) Time-dependent alteration of the GATA3 and SLCO4C1 mRNA expression levels. (C) Western blot analysis of GATA3 (left) and SLCO4C1 (right). The bands were quantified by densitometry and normalized to the level of GAPDH. A representative band is shown. **P<0.01 versus control (n = 3 per group).

