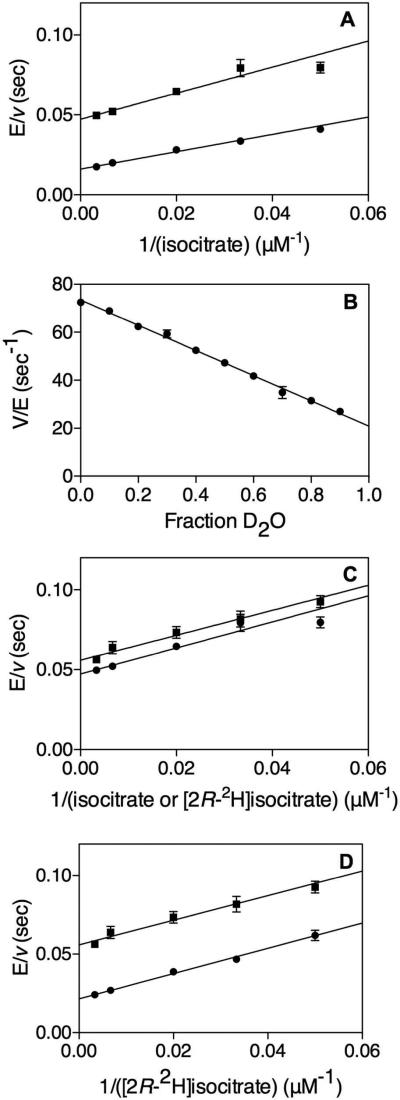
FIGURE 3.
“Solvent and Multiple Kinetic Isotope Effects.” (A) Solvent KIE with 500 μM NADP+ varying (20-300 μM) isocitrate in (●) H2O or (■) 95 % D2O. D2OV = 3.0 ± 0.2, D2O[V/Kisocitrate] = 1.5 ± 0.3. (B) Proton inventory where kcat was measured with 500 μM isocitrate and 500 μM NADP+ at 10% increments of D2O and fitted to a straight line. (C) Multiple KIE with 500 μM NADP+ varying (20-300 μM) (●) isocitrate or (■) [2R-2H]isocitrate in 95% D2O. DV = 1.2 ± 0.1, D[V/K[2R-2H]isocitrate] = 1.0 ± 0.2. (D) Multiple KIE with 500 μM NADP+ varying (20-300 μM) [2R-2H]isocitrate in (●) H O or (■) 95% D2O. D2OV = 1.7 ± 0.2, D2O[V/K[2R-2H]isocitrate] = 1.0 ± 0.2.

