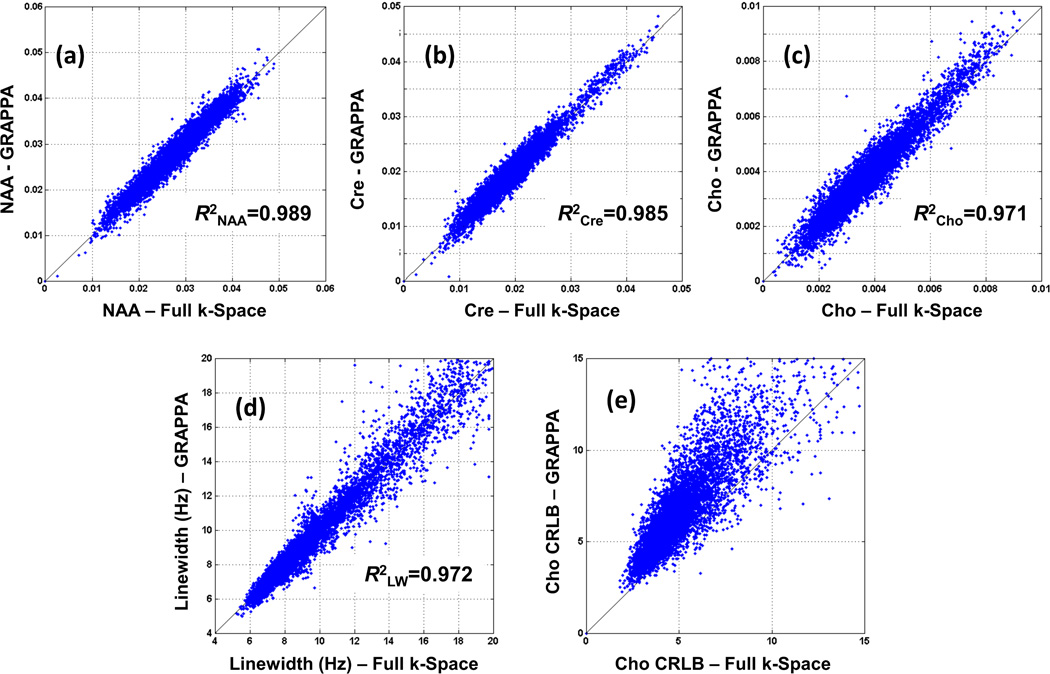
Figure 5.
Voxel metabolites concentrations from the whole-brain of a normal subject (Group 1) from GRAPPA-EPSI plotted against those obtained with full k-space EPSI for (a) NAA, (b) Cre, and (c) Cho. NAA spectral line-width comparison is also shown in (d) and the CRLB values for Cho is shown in (e).

