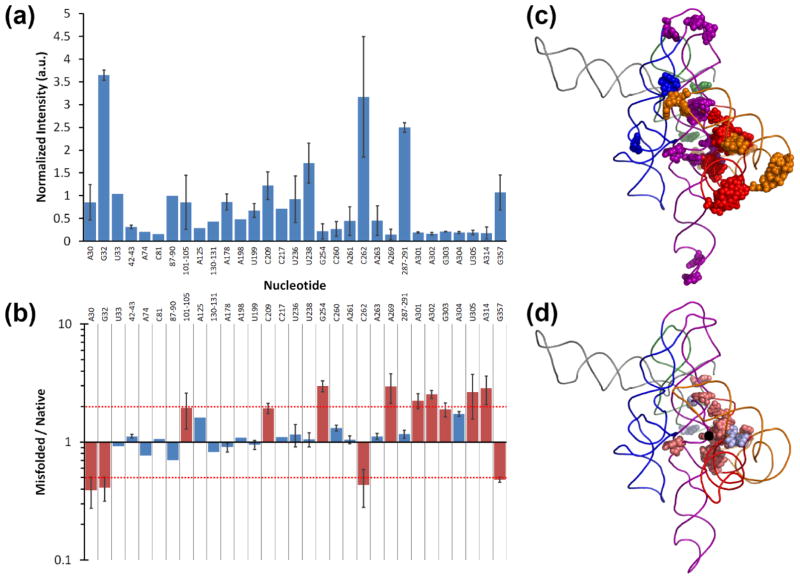
Figure 2.
In-line probing of the wild-type ribozyme. (a) Nucleotide positions that gave detectable cleavage by in-line probing of the native ribozyme. Values are reported as the normalized average and standard deviation from at least two experiments (see Methods). (b) Comparison of backbone cleavages observed in the misfolded and native states of the wild-type ribozyme. Red bars indicate individual nucleotides or groups of nucleotides that give 2-fold or greater changes, highlighting the largest differences. The red dashed lines demarcate 2-fold changes. (c) Positions within the three-dimensional structure of the ribozyme of nucleotides that gave detectable cleavage in in-line probing experiments (colored by domain). (d) Positions of nucleotides that gave differences by in-line probing in the M and N states. Nucleotides that were cleaved to a greater extent in the misfolded state colored pale red and those that were cleaved to a greater extent in the native state colored pale blue. In panels c and d a ribozyme model is shown,64 with the P2 domain in orange, P3–P8 domain in red, P4–P6 in purple, P5abc in blue, and P9 in green. Regions not probed are in gray. P1 and P10 are omitted for clarity. Nucleotide A105 is indicated by a black dot.

